- Load the R packages we will use.
- Read the data in the file,
drug_cos.csvin to the R and assign it todrug_cos.
drug_cos <- read_csv("https://estanny.com/static/week5/drug_cos.csv")
- Use
glimpse()to get a glimpse of your data.
glimpse(drug_cos)
Rows: 104
Columns: 9
$ ticker       <chr> "ZTS", "ZTS", "ZTS", "ZTS", "ZTS", "ZTS", "ZTS"~
$ name         <chr> "Zoetis Inc", "Zoetis Inc", "Zoetis Inc", "Zoet~
$ location     <chr> "New Jersey; U.S.A", "New Jersey; U.S.A", "New ~
$ ebitdamargin <dbl> 0.149, 0.217, 0.222, 0.238, 0.182, 0.335, 0.366~
$ grossmargin  <dbl> 0.610, 0.640, 0.634, 0.641, 0.635, 0.659, 0.666~
$ netmargin    <dbl> 0.058, 0.101, 0.111, 0.122, 0.071, 0.168, 0.163~
$ ros          <dbl> 0.101, 0.171, 0.176, 0.195, 0.140, 0.286, 0.321~
$ roe          <dbl> 0.069, 0.113, 0.612, 0.465, 0.285, 0.587, 0.488~
$ year <dbl> 2011, 2012, 2013, 2014, 2015, 2016, 2017, 2018,~- Use
distinct()to subset distinct rows.
# A tibble: 8 x 1
   year
  <dbl>
1  2011
2  2012
3  2013
4  2014
5  2015
6  2016
7  2017
8 2018- Use
count()to count observations by group.
# A tibble: 8 x 2
   year     n
  <dbl> <int>
1  2011    13
2  2012    13
3  2013    13
4  2014    13
5  2015    13
6  2016    13
7  2017    13
8 2018 13# A tibble: 13 x 2
name n
<chr> <int>
1 AbbVie Inc 8
2 Allergan plc 8
3 Amgen Inc 8
4 Biogen Inc 8
5 Bristol Myers Squibb Co 8
6 ELI LILLY & Co 8
7 Gilead Sciences Inc 8
8 Johnson & Johnson 8
9 Merck & Co Inc 8
10 Mylan NV 8
11 PERRIGO Co plc 8
12 Pfizer Inc 8
13 Zoetis Inc 8# A tibble: 13 x 3
ticker name n
<chr> <chr> <int>
1 ABBV AbbVie Inc 8
2 AGN Allergan plc 8
3 AMGN Amgen Inc 8
4 BIIB Biogen Inc 8
5 BMY Bristol Myers Squibb Co 8
6 GILD Gilead Sciences Inc 8
7 JNJ Johnson & Johnson 8
8 LLY ELI LILLY & Co 8
9 MRK Merck & Co Inc 8
10 MYL Mylan NV 8
11 PFE Pfizer Inc 8
12 PRGO PERRIGO Co plc 8
13 ZTS Zoetis Inc 8Use filter() to extract rows that meet criteria
- Extract rows in non-consecutive years
# A tibble: 26 x 9
   ticker name       location ebitdamargin grossmargin netmargin   ros
   <chr>  <chr>      <chr>           <dbl>       <dbl>     <dbl> <dbl>
 1 ZTS    Zoetis Inc New Jer~        0.222       0.634     0.111 0.176
 2 ZTS    Zoetis Inc New Jer~        0.379       0.672     0.245 0.326
 3 PRGO   PERRIGO C~ Ireland         0.236       0.362     0.125 0.19
 4 PRGO   PERRIGO C~ Ireland         0.178       0.387     0.028 0.088
 5 PFE    Pfizer Inc New Yor~        0.634       0.814     0.427 0.51
 6 PFE    Pfizer Inc New Yor~        0.34        0.79      0.208 0.221
 7 MYL    Mylan NV   United ~        0.228       0.44      0.09  0.153
 8 MYL    Mylan NV   United ~        0.258       0.35      0.031 0.074
 9 MRK    Merck & C~ New Jer~        0.282       0.615     0.1   0.123
10 MRK    Merck & C~ New Jer~        0.313       0.681     0.147 0.206
# ... with 16 more rows, and 2 more variables: roe <dbl>, year <dbl>- Extract every other year from 2012 to 2018
# A tibble: 52 x 9
   ticker name      location ebitdamargin grossmargin netmargin    ros
   <chr>  <chr>     <chr>           <dbl>       <dbl>     <dbl>  <dbl>
 1 ZTS    Zoetis I~ New Jer~        0.217       0.64      0.101  0.171
 2 ZTS    Zoetis I~ New Jer~        0.238       0.641     0.122  0.195
 3 ZTS    Zoetis I~ New Jer~        0.335       0.659     0.168  0.286
 4 ZTS    Zoetis I~ New Jer~        0.379       0.672     0.245  0.326
 5 PRGO   PERRIGO ~ Ireland         0.226       0.345     0.127  0.183
 6 PRGO   PERRIGO ~ Ireland         0.157       0.371     0.059  0.104
 7 PRGO   PERRIGO ~ Ireland        -0.791       0.389    -0.76  -0.877
 8 PRGO   PERRIGO ~ Ireland         0.178       0.387     0.028  0.088
 9 PFE    Pfizer I~ New Yor~        0.447       0.82      0.267  0.307
10 PFE    Pfizer I~ New Yor~        0.359       0.807     0.184  0.247
# ... with 42 more rows, and 2 more variables: roe <dbl>, year <dbl>- Extract the tickers “PFE” and “MYL”
# A tibble: 16 x 9
   ticker name       location ebitdamargin grossmargin netmargin   ros
   <chr>  <chr>      <chr>           <dbl>       <dbl>     <dbl> <dbl>
 1 PFE    Pfizer Inc New Yor~        0.371       0.795     0.164 0.223
 2 PFE    Pfizer Inc New Yor~        0.447       0.82      0.267 0.307
 3 PFE    Pfizer Inc New Yor~        0.634       0.814     0.427 0.51
 4 PFE    Pfizer Inc New Yor~        0.359       0.807     0.184 0.247
 5 PFE    Pfizer Inc New Yor~        0.289       0.803     0.142 0.183
 6 PFE    Pfizer Inc New Yor~        0.267       0.767     0.137 0.158
 7 PFE    Pfizer Inc New Yor~        0.353       0.786     0.406 0.233
 8 PFE    Pfizer Inc New Yor~        0.34        0.79      0.208 0.221
 9 MYL    Mylan NV   United ~        0.245       0.418     0.088 0.161
10 MYL    Mylan NV   United ~        0.244       0.428     0.094 0.163
11 MYL    Mylan NV   United ~        0.228       0.44      0.09  0.153
12 MYL    Mylan NV   United ~        0.242       0.457     0.12  0.169
13 MYL    Mylan NV   United ~        0.243       0.447     0.09  0.133
14 MYL    Mylan NV   United ~        0.19        0.424     0.043 0.052
15 MYL    Mylan NV   United ~        0.272       0.402     0.058 0.121
16 MYL    Mylan NV   United ~        0.258       0.35      0.031 0.074
# ... with 2 more variables: roe <dbl>, year <dbl>
Use select() to select, rename and reorder columns
- Select columns
ticker,nameandros
# A tibble: 104 x 3
   ticker name             ros
   <chr>  <chr>          <dbl>
 1 ZTS    Zoetis Inc     0.101
 2 ZTS    Zoetis Inc     0.171
 3 ZTS    Zoetis Inc     0.176
 4 ZTS    Zoetis Inc     0.195
 5 ZTS    Zoetis Inc     0.14
 6 ZTS    Zoetis Inc     0.286
 7 ZTS    Zoetis Inc     0.321
 8 ZTS    Zoetis Inc     0.326
 9 PRGO   PERRIGO Co plc 0.178
10 PRGO   PERRIGO Co plc 0.183
# ... with 94 more rows- Use
selectto exclude columnsticker,nameandros
# A tibble: 104 x 6
   location          ebitdamargin grossmargin netmargin   roe  year
   <chr>                    <dbl>       <dbl>     <dbl> <dbl> <dbl>
 1 New Jersey; U.S.A        0.149       0.61      0.058 0.069  2011
 2 New Jersey; U.S.A        0.217       0.64      0.101 0.113  2012
 3 New Jersey; U.S.A        0.222       0.634     0.111 0.612  2013
 4 New Jersey; U.S.A        0.238       0.641     0.122 0.465  2014
 5 New Jersey; U.S.A        0.182       0.635     0.071 0.285  2015
 6 New Jersey; U.S.A        0.335       0.659     0.168 0.587  2016
 7 New Jersey; U.S.A        0.366       0.666     0.163 0.488  2017
 8 New Jersey; U.S.A        0.379       0.672     0.245 0.694  2018
 9 Ireland                  0.216       0.343     0.123 0.248  2011
10 Ireland                  0.226       0.345     0.127 0.236  2012
# ... with 94 more rows- Rename and reorder columns with
select
Start with
drug_cosTHENChange the name of
locationtoheadquarterPut the columns in this order:
year,ticker,headquarter,netmargin,roe
# A tibble: 104 x 5
    year ticker headquarter       netmargin   roe
   <dbl> <chr>  <chr>                 <dbl> <dbl>
 1  2011 ZTS    New Jersey; U.S.A     0.058 0.069
 2  2012 ZTS    New Jersey; U.S.A     0.101 0.113
 3  2013 ZTS    New Jersey; U.S.A     0.111 0.612
 4  2014 ZTS    New Jersey; U.S.A     0.122 0.465
 5  2015 ZTS    New Jersey; U.S.A     0.071 0.285
 6  2016 ZTS    New Jersey; U.S.A     0.168 0.587
 7  2017 ZTS    New Jersey; U.S.A     0.163 0.488
 8  2018 ZTS    New Jersey; U.S.A     0.245 0.694
 9  2011 PRGO   Ireland               0.123 0.248
10  2012 PRGO   Ireland               0.127 0.236
# ... with 94 more rows
Question: filter and select
Use inputs from your quiz question *** filter and select*** and replace see quiz with inputs from your quiz and replace the ??? in the code
- Start with
drugs_cosTHEN - Extract information from the tickers SEE Quiz THEN
- Select the variables
ticker,yearandros
# A tibble: 24 x 3
   ticker  year   ros
   <chr>  <dbl> <dbl>
 1 BMY     2011 0.256
 2 BMY     2012 0.102
 3 BMY     2013 0.175
 4 BMY     2014 0.148
 5 BMY     2015 0.121
 6 BMY     2016 0.302
 7 BMY     2017 0.249
 8 BMY     2018 0.263
 9 BIIB    2011 0.333
10 BIIB    2012 0.335
# ... with 14 more rows
Questions: rename
- Start with
drugs_cosTHEN - Extract information for the tickers LLY, MRK THEN
- Select the variables
ticker,ros, androe, Change the name ofroetoreturn_on_equity# A tibble: 16 x 3 ticker ros return_on_equity <chr> <dbl> <dbl> 1 MRK 0.15 0.114 2 MRK 0.182 0.113 3 MRK 0.123 0.089 4 MRK 0.409 0.248 5 MRK 0.136 0.096 6 MRK 0.117 0.092 7 MRK 0.162 0.063 8 MRK 0.206 0.199 9 LLY 0.22 0.306 10 LLY 0.239 0.273 11 LLY 0.255 0.29 12 LLY 0.153 0.138 13 LLY 0.14 0.162 14 LLY 0.159 0.185 15 LLY 0.096 -0.015 16 LLY 0.155 0.264selectranges of colomns
- by name
# A tibble: 104 x 3 ebitdamargin grossmargin netmargin <dbl> <dbl> <dbl> 1 0.149 0.61 0.058 2 0.217 0.64 0.101 3 0.222 0.634 0.111 4 0.238 0.641 0.122 5 0.182 0.635 0.071 6 0.335 0.659 0.168 7 0.366 0.666 0.163 8 0.379 0.672 0.245 9 0.216 0.343 0.123 10 0.226 0.345 0.127 # ... with 94 more rows- by position
# A tibble: 104 x 3 ebitdamargin grossmargin netmargin <dbl> <dbl> <dbl> 1 0.149 0.61 0.058 2 0.217 0.64 0.101 3 0.222 0.634 0.111 4 0.238 0.641 0.122 5 0.182 0.635 0.071 6 0.335 0.659 0.168 7 0.366 0.666 0.163 8 0.379 0.672 0.245 9 0.216 0.343 0.123 10 0.226 0.345 0.127 # ... with 94 more rowsselecthelper funtions
starts_with("abc")matches columns that start with “abc”ends_with("abc")matches columns end with “abc”contains("abc")matches column contain “abc”
# A tibble: 104 x 2
   ticker location
   <chr>  <chr>
 1 ZTS    New Jersey; U.S.A
 2 ZTS    New Jersey; U.S.A
 3 ZTS    New Jersey; U.S.A
 4 ZTS    New Jersey; U.S.A
 5 ZTS    New Jersey; U.S.A
 6 ZTS    New Jersey; U.S.A
 7 ZTS    New Jersey; U.S.A
 8 ZTS    New Jersey; U.S.A
 9 PRGO   Ireland
10 PRGO   Ireland
# ... with 94 more rows
drug_cos %>% select(ticker, starts_with("r"))# A tibble: 104 x 3 ticker ros roe <chr> <dbl> <dbl> 1 ZTS 0.101 0.069 2 ZTS 0.171 0.113 3 ZTS 0.176 0.612 4 ZTS 0.195 0.465 5 ZTS 0.14 0.285 6 ZTS 0.286 0.587 7 ZTS 0.321 0.488 8 ZTS 0.326 0.694 9 PRGO 0.178 0.248 10 PRGO 0.183 0.236 # ... with 94 more rows# A tibble: 104 x 4 year ebitdamargin grossmargin netmargin <dbl> <dbl> <dbl> <dbl> 1 2011 0.149 0.61 0.058 2 2012 0.217 0.64 0.101 3 2013 0.222 0.634 0.111 4 2014 0.238 0.641 0.122 5 2015 0.182 0.635 0.071 6 2016 0.335 0.659 0.168 7 2017 0.366 0.666 0.163 8 2018 0.379 0.672 0.245 9 2011 0.216 0.343 0.123 10 2012 0.226 0.345 0.127 # ... with 94 more rowsUse
group_byto set up data for operations by groupgroup_by
# A tibble: 104 x 9 # Groups: ticker [13] ticker name location ebitdamargin grossmargin netmargin ros <chr> <chr> <chr> <dbl> <dbl> <dbl> <dbl> 1 ZTS Zoetis Inc New Jer~ 0.149 0.61 0.058 0.101 2 ZTS Zoetis Inc New Jer~ 0.217 0.64 0.101 0.171 3 ZTS Zoetis Inc New Jer~ 0.222 0.634 0.111 0.176 4 ZTS Zoetis Inc New Jer~ 0.238 0.641 0.122 0.195 5 ZTS Zoetis Inc New Jer~ 0.182 0.635 0.071 0.14 6 ZTS Zoetis Inc New Jer~ 0.335 0.659 0.168 0.286 7 ZTS Zoetis Inc New Jer~ 0.366 0.666 0.163 0.321 8 ZTS Zoetis Inc New Jer~ 0.379 0.672 0.245 0.326 9 PRGO PERRIGO C~ Ireland 0.216 0.343 0.123 0.178 10 PRGO PERRIGO C~ Ireland 0.226 0.345 0.127 0.183 # ... with 94 more rows, and 2 more variables: roe <dbl>, year <dbl># A tibble: 104 x 9 # Groups: year [8] ticker name location ebitdamargin grossmargin netmargin ros <chr> <chr> <chr> <dbl> <dbl> <dbl> <dbl> 1 ZTS Zoetis Inc New Jer~ 0.149 0.61 0.058 0.101 2 ZTS Zoetis Inc New Jer~ 0.217 0.64 0.101 0.171 3 ZTS Zoetis Inc New Jer~ 0.222 0.634 0.111 0.176 4 ZTS Zoetis Inc New Jer~ 0.238 0.641 0.122 0.195 5 ZTS Zoetis Inc New Jer~ 0.182 0.635 0.071 0.14 6 ZTS Zoetis Inc New Jer~ 0.335 0.659 0.168 0.286 7 ZTS Zoetis Inc New Jer~ 0.366 0.666 0.163 0.321 8 ZTS Zoetis Inc New Jer~ 0.379 0.672 0.245 0.326 9 PRGO PERRIGO C~ Ireland 0.216 0.343 0.123 0.178 10 PRGO PERRIGO C~ Ireland 0.226 0.345 0.127 0.183 # ... with 94 more rows, and 2 more variables: roe <dbl>, year <dbl>Use
summarizeto calculate summary statistics- Maximum
roefor all companies
- maximum
roefor eachyear
# A tibble: 8 x 2 year max_roe <dbl> <dbl> 1 2011 0.451 2 2012 0.69 3 2013 1.13 4 2014 0.828 5 2015 1.31 6 2016 1.11 7 2017 0.932 8 2018 0.694- maximum
roefor eachticker
# A tibble: 13 x 2 ticker max_roe <chr> <dbl> 1 ABBV 1.31 2 AGN 0.184 3 AMGN 0.585 4 BIIB 0.334 5 BMY 0.373 6 GILD 1.04 7 JNJ 0.244 8 LLY 0.306 9 MRK 0.248 10 MYL 0.283 11 PFE 0.342 12 PRGO 0.248 13 ZTS 0.694Question: summarize
Mean for year
*find the mean grossmargin for each
yearand call the variable mean_grossmargin- Extract the mean for 2015
drug_cos %>% group_by(year) %>% summarize(mean_grossmargin = mean(grossmargin)) %>% filter( year == 2015)# A tibble: 1 x 2 year mean_grossmargin <dbl> <dbl> 1 2015 0.712- The mean grossmargin for 2015 is ??? or ???%
Median for year
- Find the median ** SEE QUIZ** for each
yearand call the variable `` median_ median_grossmargin
*Extract the median for 2015
drug_cos %>%
  group_by(year) %>%
  summarize(median_grossmargin = median(grossmargin)) %>%
  filter( year == 2015)
# A tibble: 1 x 2 year median_grossmargin <dbl> <dbl> 1 2015 0.764- Pick a ratio and a year and compare the companies
drug_cos %>%
  filter(year == 2018) %>%
  ggplot(aes(x = netmargin, y = reorder(name, netmargin))) +
geom_col() +
  scale_x_continuous(labels = scales::percent) +
  labs(title = "Comparison of net margin",
       subtitle = "for drug companies during 2018",
       x = NULL, y = NULL) +
  theme_classic()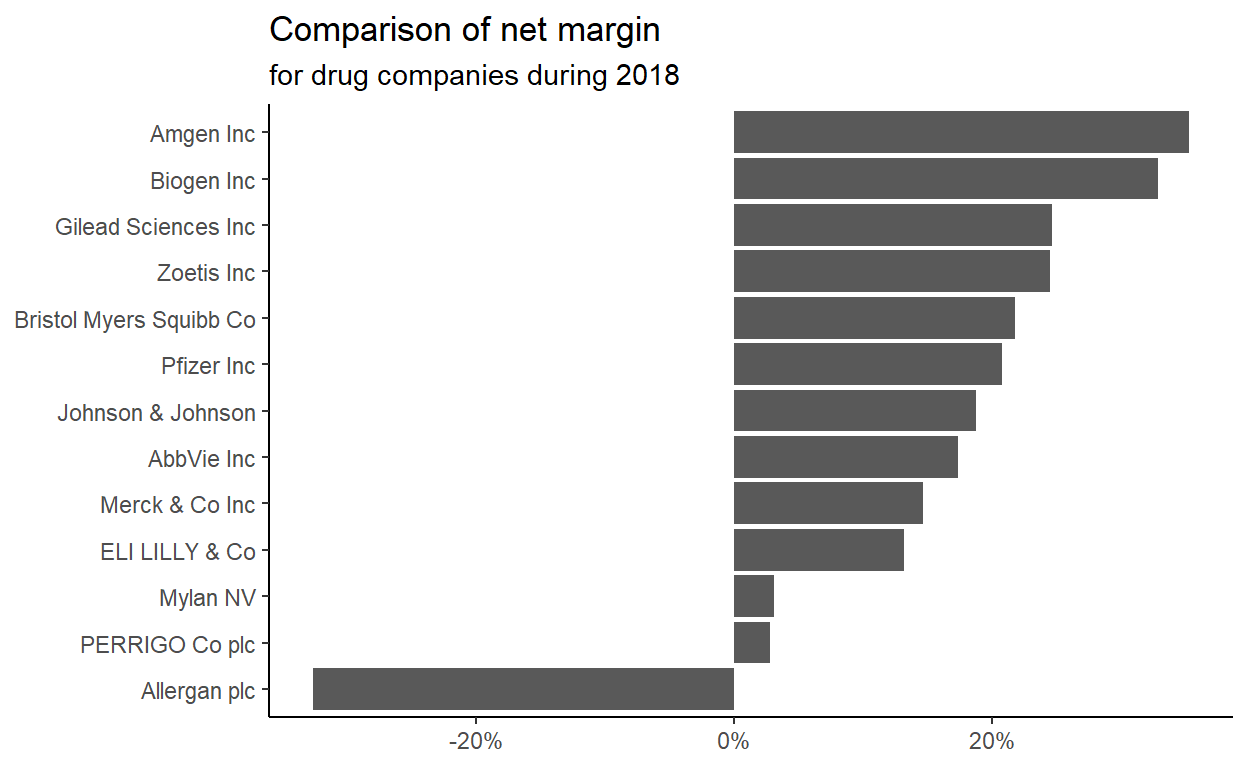
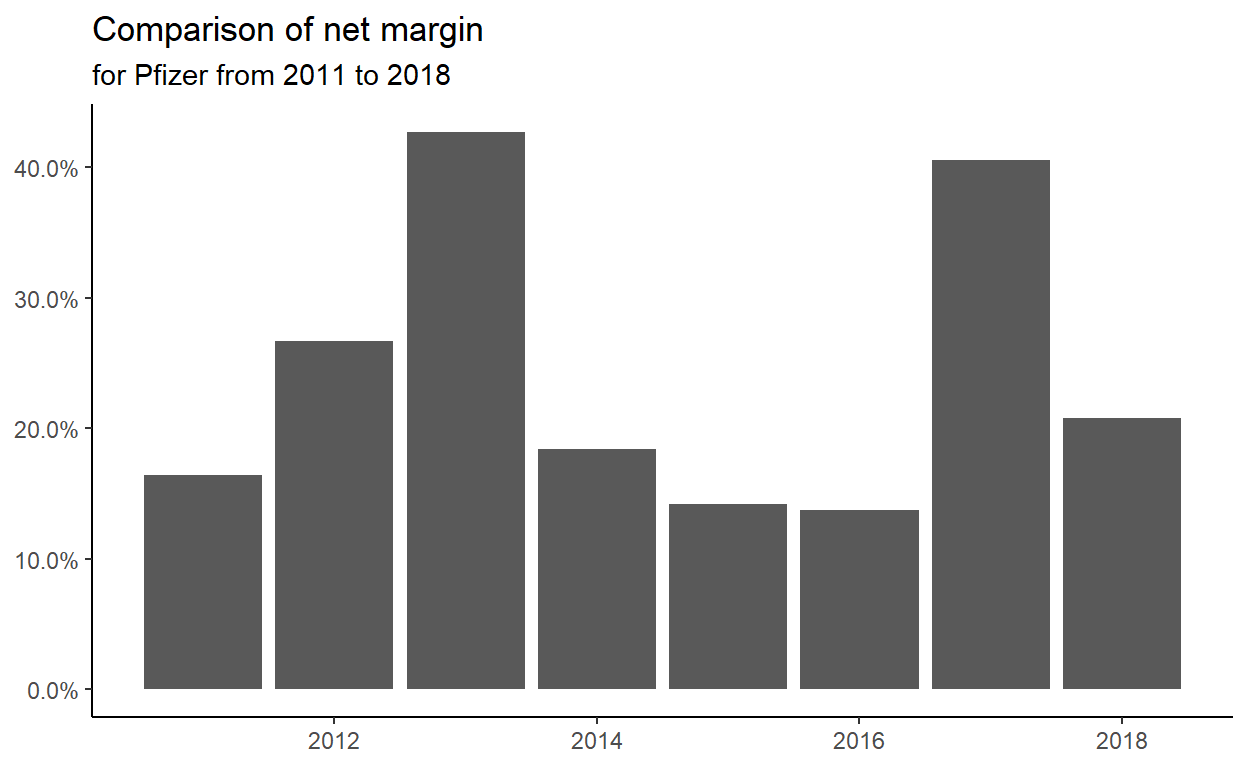
- Pick a company and a ratio and compare the ratio over time.
drug_cos %>%
  filter(ticker == "PFE") %>%
  ggplot(aes(x = year, y = netmargin)) +
geom_col() +
  scale_y_continuous(labels = scales::percent) +
  labs(title = "Comparison of net margin",
       subtitle = "for Pfizer from 2011 to 2018",
       x = NULL, y = NULL) +
  theme_classic()